Dashboard
Overview
The Dashboard area gives you access to visual metrics that help you monitor posture, vulnerability trends, developer engagement, and coverage.
Usage
In the left menu, click on Dashboard:
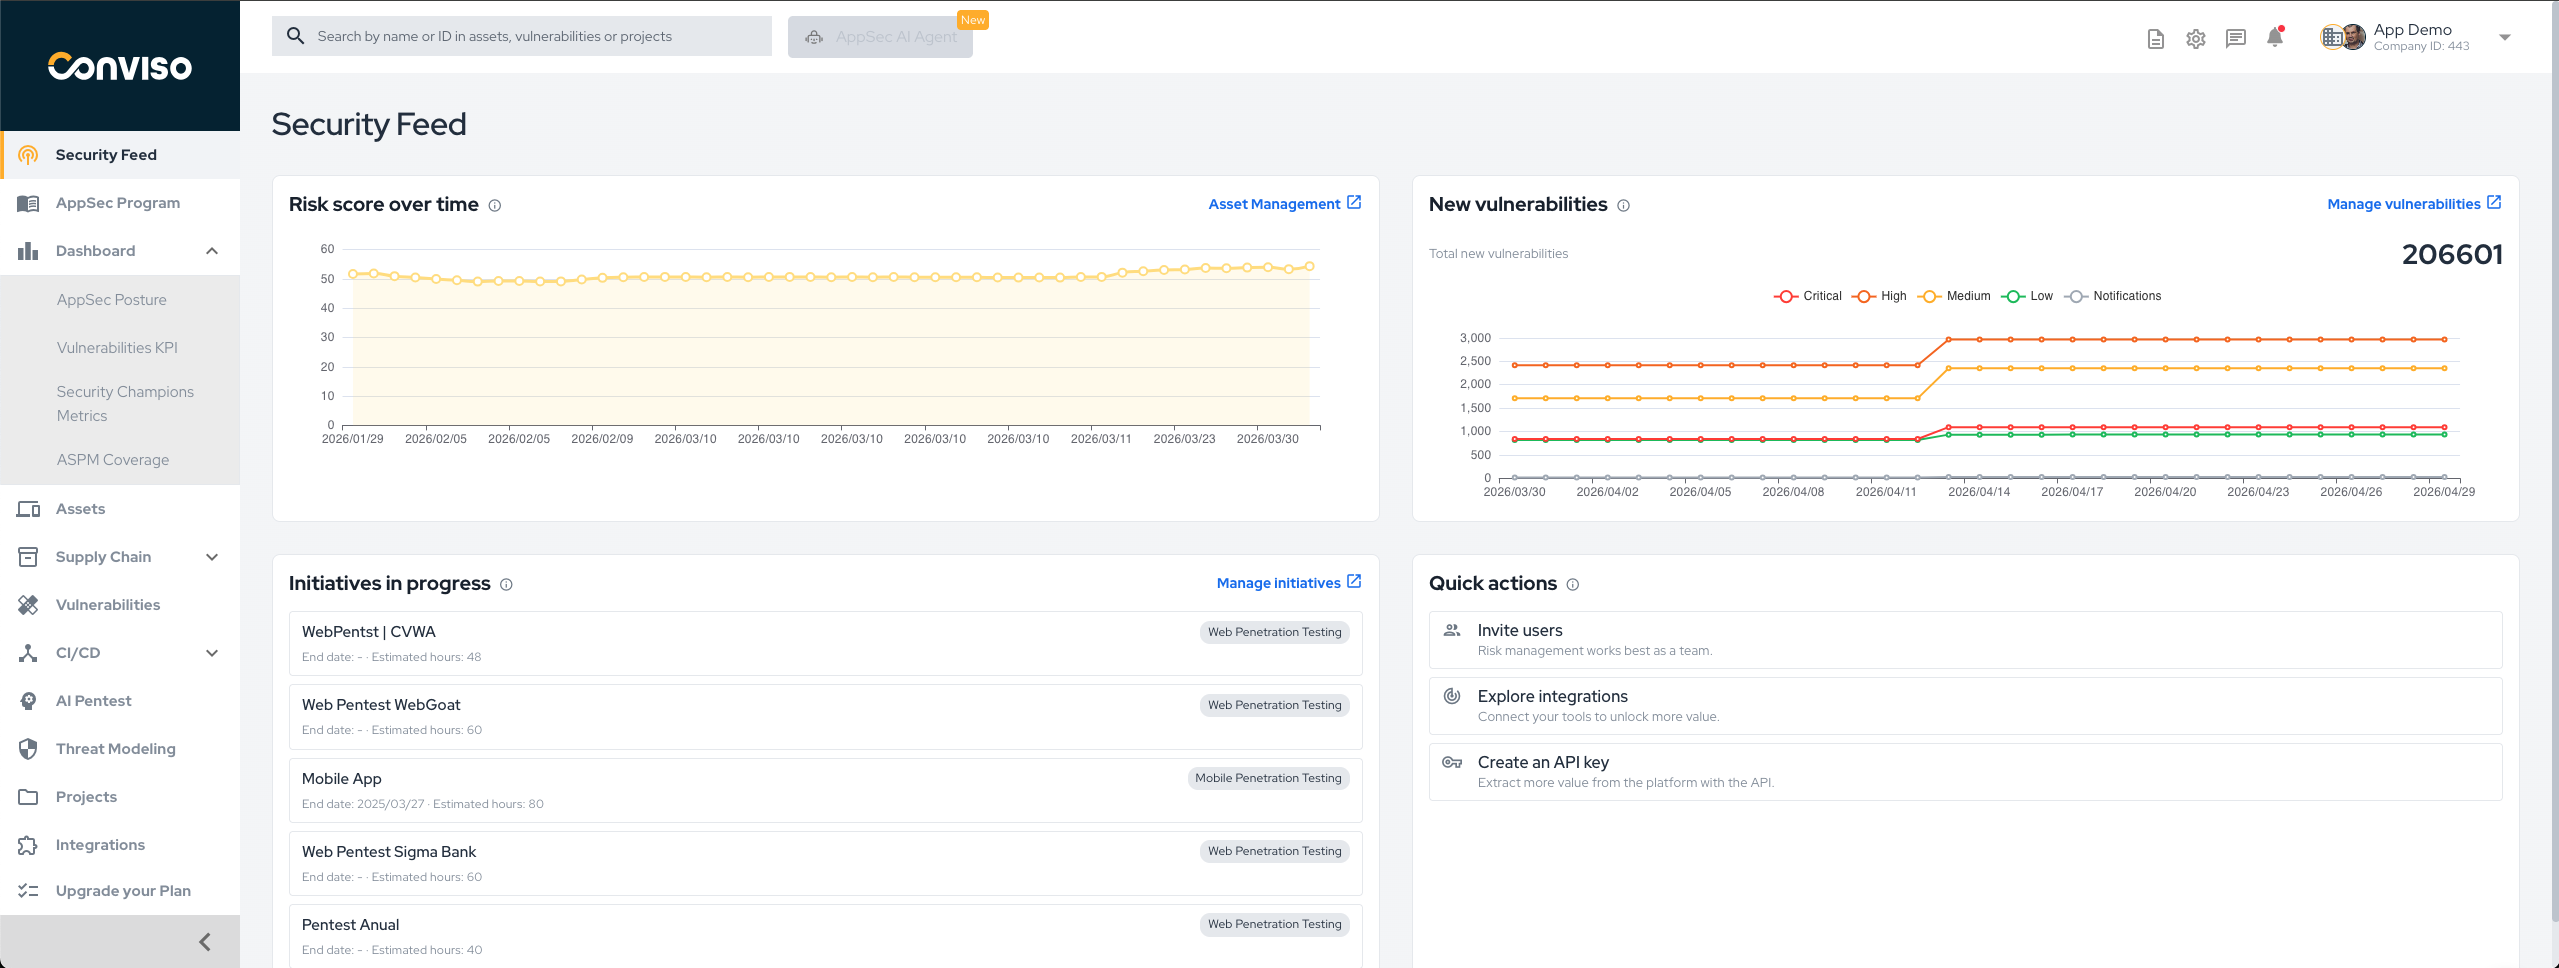
Available Dashboards
The platform currently provides four dashboard views:
Use these pages when you need detailed guidance about what each dashboard shows and how to interpret the charts.
Filters
By default, dashboards are filtered to show the last 7 days. You can refine the view using:
- Date: a preset (Today, Yesterday, 7D, 30D, 3M, 6M, 12M) or a Custom range. For a custom range, click the start date and then the end date in the calendar;
- Assets;
- Assets Tags;
- Archived assets: Hidden (default), Included, or Only archived.
Clear resets the filters to their defaults.

These filters are applied across the selected dashboard and help you focus the analysis on a specific time window or asset group. On the Vulnerability KPI dashboard, some charts use only the end date of the period; see Vulnerability KPI.
For vulnerability status definitions used in dashboard filters and charts, see Workflow Status.
Support
Should you have any questions or require assistance while using the Conviso Platform, feel free to reach out to our dedicated support team.
Contribute to the Docs
Found something outdated or missing? Help us improve the documentation with a quick suggestion or edit.
How to contribute